Trends in the Rate of Child Abuse
As for changes over time, the fourth NIS study found that maltreatment declined by 26 percent since the third NIS survey in 1993. The level of maltreatment in 2005–2006 had dropped to the level observed in the second NIS survey, which was carried out in 1986. In other words, after increasing from 1986 to 1993, maltreatment fell back to its 1986 level. The sexual abuse rate tum- bled by 44 percent and the physical abuse rate declined by 23 percent over the 12-year period (ACF, 2010:5).
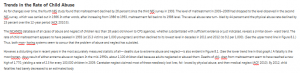
The NCANDS database of all cases of abuse and neglect of children less than 18 years old known to CPS agencies, whether substantiated with sufficient evidence or just indicated, reveals a similar down- ward trend. The rate of child maltreatment appears to have peaked in 1993 (at 15.3 victims per 1,000 youngsters) and then declined to its lowest level in decades in 2011 and 2012 (to 9.2 per 1,000). (See the upper trend line in Figure 8.1.) Thus, both mon- itoring systems seem to concur that the problem of abuse and neglect has subsided.
However, a disturbing rise in recent years in the most accurately measured statistic of all— deaths due to extreme abuse and neglect—is also evident in Figure 8.1. (See the lower trend line in that graph.) A fatality is the most horren- dous result of either extreme abuse or neglect. In the mid-1990s, about 1,100 children died because adults neglected or abused them. Deaths of chil- dren from maltreatment seem to have reached a new high of 1,770, yielding a rate of 2.3 for every 100,000 children in 2009. Caretaker neglect claimed most of these needlessly lost lives, fol- lowed by physical abuse, and then medical neglect (ACF, 2010). By 2012, child fatalities had barely decreased to an estimated body
266 CH APT ER 8
Copyright 2016 Cengage Learning. All Rights Reserved. May not be copied, scanned, or duplicated, in whole or in part. WCN 02-200-203
count of 1,640 and a mortality rate of 2.2 per 100,000 (ACF, 2013).
This gruesome statistic is being measured more accurately as time passes because more states are closely monitoring and reporting these deaths. In addition, a growing number of jurisdictions have set up a child fatality review team made up of cor- oners, detectives, prosecutors, and social workers. The first child fatality review teams were set up in California, Oregon, and North Carolina in 1978 to carry out more thorough investigations and to keep better records about these cases. A National Center for Child Death Review and a National Coalition to End Child Abuse Deaths are among the organi- zations that have been established as information clearinghouses and to advocate for increased support for treatment and prevention programs (Langstaff and Sleeper, 2001).
However, between 2005 and 2009, Congress substantially reduced federal funding to states ear- marked to treat and protect abused and neglected children, and 45 states cut vital services for children and families (Every Child Matters, 2011). The
actual annual death toll may have been even higher, according to a report by the General Accounting Office (GAO, 2011), which detected undercount- ing problems (for example, cases of shaken baby syndrome may have been systematically over- looked). Based on the GAO’s findings, a report to a congressional hearing projected an actual body count of about 2,500 (Webster, 2011).
In general, the social factors that contribute to child abuse and neglect are related to poverty and governmental inaction: high levels of violent crime, alcohol and drug problems among adults, teenage motherhood, elevated high school drop- out rates, and high rates of imprisonment. The social conditions that decrease maltreatment are upturns in the nation’s economy, a trend toward marrying later in life and having fewer children, greater public awareness and condemnation of abuse, investments in treatment and prevention programs, and more shelters for battered women and their offspring. If the seriousness of abuse really did diminish in American society, the improvement may have been due to stepped up
F I G U R E 8.1 Trends in Child Maltreatment Rates, United States, 1990–2012 SOURCES: NCANDS, 1990–2012.
V I C T IM I Z ED CH I LDREN 267
Copyright 2016 Cengage Learning. All Rights Reserved. May not be copied, scanned, or duplicated, in whole or in part. WCN 02-200-203
prevention efforts, increased prosecutions and incarcerations of offenders, and profound cultural changes in parental attitudes and behaviors toward children. On a societal basis, child maltreatment is less of a problem in nations that offer their citizens universal health insurance, child care, preschool, parental leave, and visiting nurse services (Straus and Gelles, 1986; Finkelhor and Jones, 2004; and Petit, 2011).
Differential Risks Children Face of Being Maltreated
As with all other forms of victimizations, certain groups face greater dangers than others.
For example, geography is an important risk factor: The state (in terms of its social problems and its government services—and possibly its reporting and investigating practices) in which a child grows up appears to be related to levels of abuse, and even more tragically, of premature deaths.
Victimization rates were much higher than the national figure of 9.2 per 1,000 in the District of Columbia, Alaska, Arkansas, Florida, Iowa, Kentucky, Massachusetts, Michigan, and Rhode Island. Maltreatment rates were below the national average in Arizona, Hawaii, New Jersey, Wisconsin, Vermont, and Washington; and these rates were extremely low in Minnesota, Missouri, New Hampshire, Kansas, Virginia, and Pennsylvania dur- ing 2012 (ACF, 2013).
Reported child fatality rates (which fluctuate considerably from year to year) were much higher in Arkansas and Florida (over 4 per 100,000) than they were in Hawaii, New Jersey, Iowa, Minnesota, Montana, North Dakota, Connecticut, Vermont, and New Hampshire (all less than 1 per 100,000) in 2012 (ACF, 2013).
As for the chances of being abused or neglected, differential risks can be determined by reviewing the findings of the annual reports derived from the NCANDS database and the periodic NIS studies. The profile of youngsters facing the highest odds of maltreatment can be determined from the statistics in these two official sources. Girls generally
experience slightly higher rates of maltreatment than boys. Sexual abuse is imposed on girls much more often than boys. Another demographic risk factor is race and ethnicity. Disproportionately higher rates of maltreatment (compared to their numbers in the population) were endured by African-American and (to a lesser extent) Hispanic youth, while white and other youngsters experi- enced disproportionately lower rates. As for social class, youngsters growing up in poverty-stricken homes and in households with an unemployed par- ent were more likely than others to be maltreated. Children living in families with both biological par- ents had the lowest rates of abuse and neglect; youngsters whose single parent had a live-in partner suffered the highest rates of abuse and neglect. Larger families (four or more children) were sites of abuse more than average size families (two chil- dren). Children growing up in homes beset by domestic violence between the adults were at a greater risk than youth living in more peaceful homes. Families residing in rural areas had more of a problem with neglect and abuse than urban households. Both of these sets of official statistics verify the suspicion that children with physical, emotional, and medical disabilities (such as behav- ioral disorders, mental retardation, visual and hear- ing impairment, and learning disabilities) are especially vulnerable and indeed suffer maltreat- ment at an unusually high rate. However, the NIS concluded that infants and toddlers suffered the lowest rates of maltreatment, while the annual Child Maltreatment report highlighted the greater rates of abuse and neglect faced by babies in their first year of life (ACF, 2010).
Further details about high-risk situations have been discovered from research into the back- grounds of physically abused children. Beatings are more likely to occur in dysfunctional families racked by a combination of symptoms of marital discord: The parents fight viciously (partner abuse); one or both of the parents are currently drug abusers and/or alcoholics; the mother was raised by a substance-abusing parent; and the mother was often beaten while she was growing up (Salzinger, Feldman, and Hammer, 1991).
268 CH APT ER 8
Copyright 2016 Cengage Learning. All Rights Reserved. May not be copied, scanned, or duplicated, in whole or in part. WCN 02-200-203
As for sexual abuse, which is imposed most often on boys and girls between the ages of 7 and 13, poor parent–child communication, parental unavailabil- ity, and intense father–mother conflict seem to be risk factors (Finkelhor, 1994). Sexual abuse poses a greater threat for females, according to prevalence studies. As many as 29 percent of women compared to 14 percent of men told interviewers they suffered molestations when they were children, according to a series of telephone surveys conducted from 1992 to 2007 (Stop It Now!, 2011).